Section 6.2
Using Snapshot Replay Controls
Replay a snapshot using the following procedure:
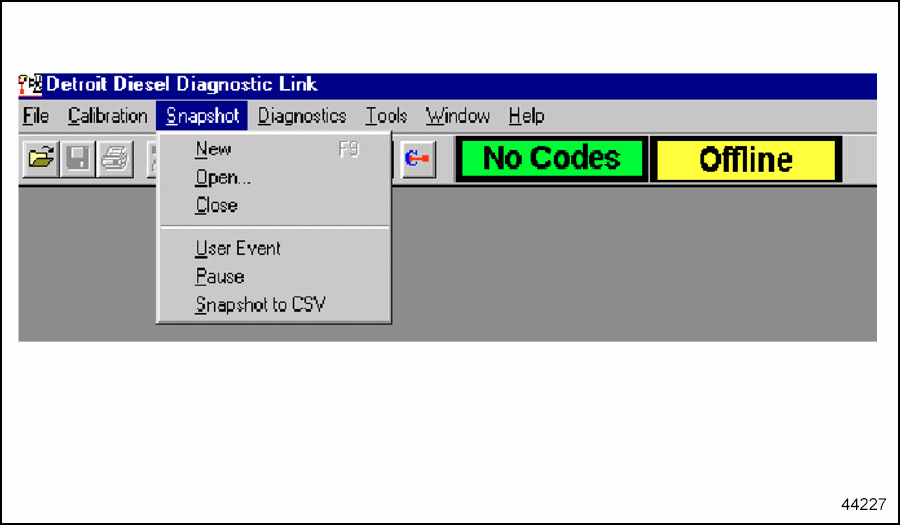
- Go to the Snapshot
drop-down menu and select Open
. Do not have the computer connected to a vehicle when replaying a snapshot. See Figure
"Snapshot Drop-Down Menu"
.

Figure 1. Snapshot Drop-Down Menu
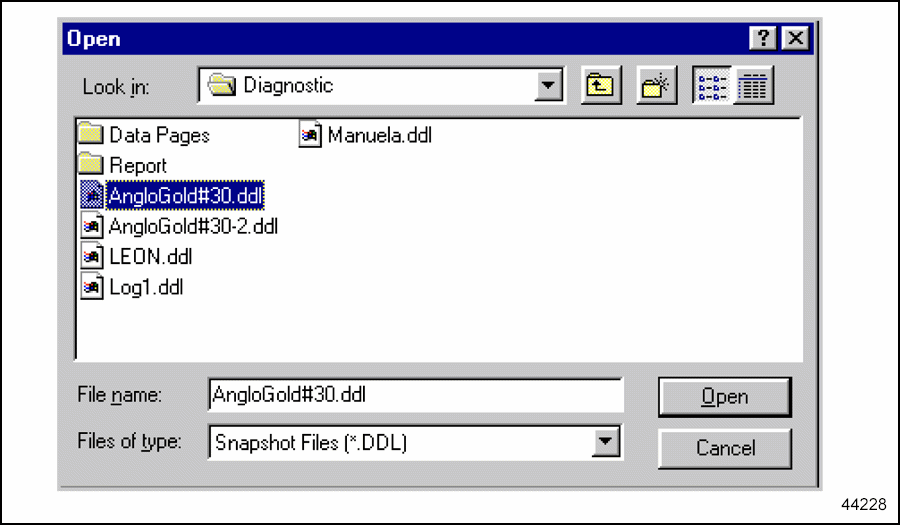
- A dialog box will appear listing all the available snapshot files. See Figure
"Snapshot Dialog Box"
.

Figure 2. Snapshot Dialog Box
Note: The default folder that snapshot files are saved in is C:\ Detroit Diesel\Diagnostic and the files have an extension of “.ddl”.
- Highlight the desired the file with one click of the left mouse button. The selected file name will now appear in the File Name box.
- Click once with the left mouse button on the Open box in the lower right of the dialog box.
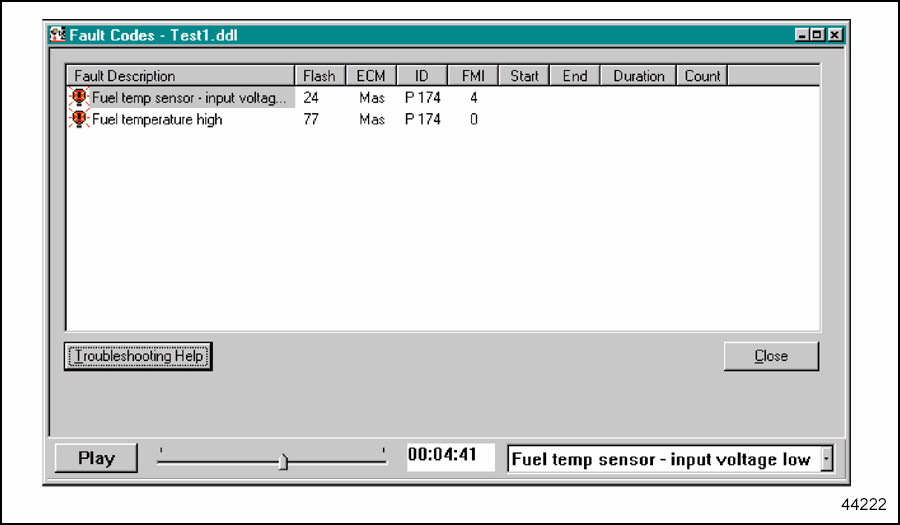
- When opening a snapshot, replay controls will appear at the bottom of the DDDL window opened. See Figure
"Snapshot Replay Controls"
.

Figure 3. Snapshot Replay Controls
- To start the replay of a snapshot, click on Play . The play button changes to Pause when a snapshot is replaying. While the snapshot is replaying, the replay slider next to the Play/Pause button moves showing the progress of the replay, and the time box next to it shows the time since the beginning of the recording. When clicking on Play , the snapshot begins to play from its current position and the instruments show the appropriate readings. The event window also changes during the replay to show the most recent event.
- To stop the replay at a particular point of interest, click on Pause . The instruments will show the values at the time the replay was stopped.
- To move to a specific time in the replay, drag the replay slider button. When dragging the slider, the time shown in the time box changes to reflect the position of the slider. See Figure
"Normal Instrumentation Window"
.

Figure 4. Normal Instrumentation Window
Note: Not all DDDL windows can be activated when replaying the snapshot feature. The response time window and the cylinder cutout window are not accessible in the injector in snapshot mode. See Figure "Diagnostic Instrumentation Window" , Figure "Graph Window" , Figure "User Window" , and Figure "Fault Codes Window" for samples of windows that may be activated.

Figure 5. Diagnostic Instrumentation Window

Figure 6. Graph Window

Figure 7. User Window

Figure 8. Fault Codes Window
| MBE 900 and MBE 4000 EGR Technician's Manual - 7SE940 |
| Generated on 10-13-2008 |